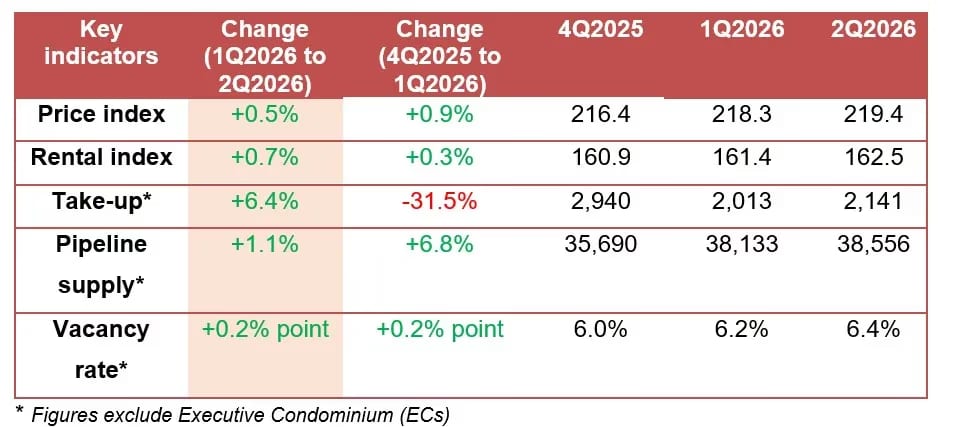
Singapore’s private residential market is showing clearer signs of moderation, but “cooling” should not be confused with a broad-based price fall. The Urban Redevelopment Authority (URA) reported that the overall private residential price index rose 0.5% quarter-on-quarter in Q2 2026, down from 0.9% in Q1. That is a slower pace, and the cumulative 1.4% gain in the first half of 2026 was below the 1.8% recorded in the first half of 2025. Yet prices at the aggregate level still increased.
For anyone tracking the apartment price in Singapore, the more useful conclusion is that this is becoming a market of segments, locations and individual projects. Buyers have more reason to compare alternatives carefully; sellers still need to anchor expectations to current evidence rather than yesterday’s headline; and investors need to separate rental resilience from capital-growth assumptions.

The headline: moderation, not a market-wide correction
The most important Q2 statistic is simple: private residential prices continued to rise, but more slowly. A 0.5% quarterly gain is not a collapse, and it does not establish a new downward trend by itself. It does, however, reinforce that the market is no longer moving with the same uniform momentum seen when buyers felt compelled to commit quickly.
The difference is meaningful in practice. In a fast-rising market, a buyer may be prepared to accept a less suitable layout or compromise on location for fear that the next comparable home will cost more. In a moderating market, that buyer can spend more time comparing tenure, remaining lease, maintenance, unit orientation, nearby supply and financing affordability. This supports better decisions, but it also makes pricing discipline more important for sellers.
99.co’s review of Q1 had already described measured price growth alongside softer activity and a growing supply pipeline. Q2 adds a further layer: sales activity improved while price growth slowed. That combination is more consistent with selective demand and changing segment preferences than with a blanket withdrawal of buyers.
What Q2 2026 means for apartment prices in Singapore
The overall figure conceals a notable split between landed and non-landed homes. Landed property prices rose 2.5% in Q2, reversing the 0.4% fall in Q1. Non-landed prices, meanwhile, edged down 0.1% after rising 1.3% in Q1.
That small non-landed decline matters because condominiums and apartments make up much of the market that buyers encounter when evaluating an apartment Singapore price. Still, it should be interpreted with care. An index movement is an aggregate measure; it does not mean every condominium was discounted or that every seller will accept a lower offer. A well-located home with limited competing stock, good condition and a practical layout can behave very differently from a project facing many comparable resale listings or new launches nearby.
For buyers, the better question is not “Will all apartment prices fall?” but “Where is choice increasing, and what is already priced competitively?” For sellers, a realistic launch price and a compelling presentation can be decisive when purchasers have time to compare multiple homes.
Regional divergence is now central to the story
Q2’s non-landed results varied sharply by market region:
- Core Central Region (CCR): +1.8%, up from +0.6% in Q1.
- Rest of Central Region (RCR): -1.2%, after +0.8% in Q1.
- Outside Central Region (OCR): -0.1%, after +2.2% in Q1.
This is why broad statements about real estate in Singapore can mislead. The CCR’s rise suggests that central-market demand remained supportive, while the RCR and OCR recorded declines after prior-quarter strength. For a purchaser considering central addresses, areas represented by District 1 and District 11 remain relevant comparison points. In family-oriented and suburban markets, District 19 and District 20 illustrate why transport access, schools, unit size and competing supply must be assessed at a local level.
A practical example: a household upgrading from a mature estate may compare a ready resale condominium with a new launch. If the resale home is immediately available and its seller is flexible, it may offer better certainty and more usable space. Conversely, a buyer with a longer horizon may value a new project’s facilities, payment schedule and future completion. The Q2 data does not automatically choose between those options; it makes careful comparison more valuable.
Transactions improved, with resale taking the lead
Cooling in price momentum did not mean buyers disappeared. Developers sold 2,141 uncompleted private residential units excluding executive condominiums (ECs) in Q2, up from 2,013 in Q1, despite launching slightly fewer units—1,783 versus 1,844.
The resale market was even more active. Resale transactions rose to 3,813, from 3,225 in Q1, and represented 62.0% of all sale transactions, up from 59.6%. This is an important signal for buyers who prioritise physical inspection, immediate occupation and the possibility of price negotiation. It also suggests that owners with good-quality, correctly priced homes can still find demand.
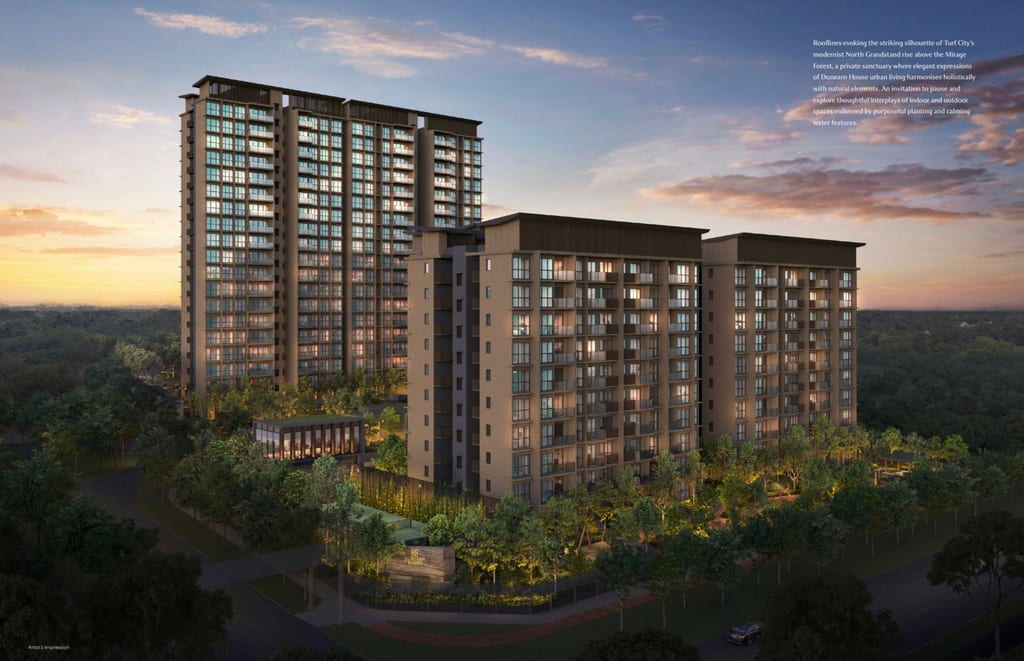
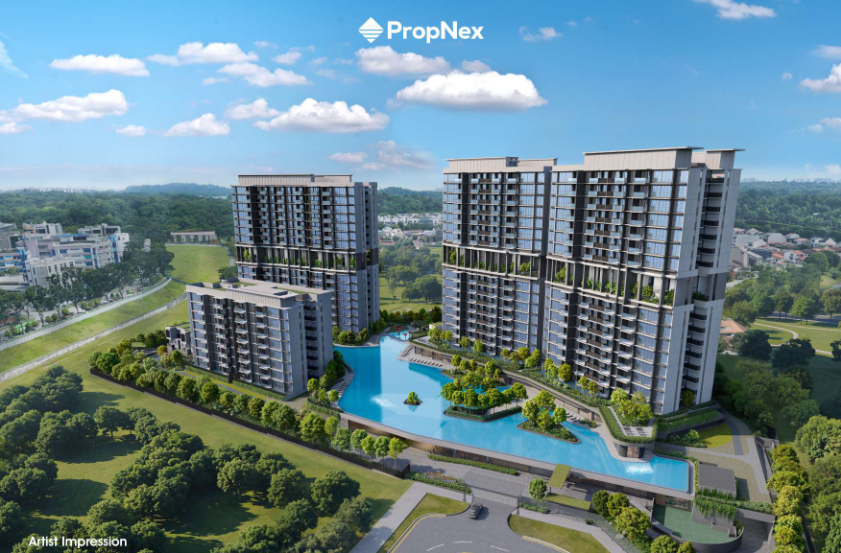
Resale is not automatically cheaper than a new launch, nor is a new launch automatically better value. Buyers should compare total purchase cost, monthly mortgage exposure, renovation needs, holding period and exit options. The available choices range from a compact freehold resale such as Neem Tree to new-launch alternatives including Dunearn House, Lentor Gardens Residences and Thomson Reserve. Each should be evaluated on its own location, tenure, unit mix and intended holding horizon rather than a single market headline.
Supply and vacancy give buyers more leverage—but not unlimited leverage
Supply remains the major medium-term moderating force. At the end of Q2, URA recorded 42,472 private units including ECs in the approved pipeline, of which 15,810 were unsold. A further 18,153 unsold units had not yet received planning approval. URA expects about 60,600 private residential units including ECs to be completed in coming years.
The Government Land Sales programme will add to choice: the 2H 2026 Confirmed List comprises 4,745 private residential units, taking full-year Confirmed List supply to 9,320 units—more than 50% above the annual average of the previous decade.
Vacancy also rose from 6.2% to 6.4% in Q2. CCR vacancy was 8.3%, compared with 6.1% in RCR and 5.6% in OCR. More choice can improve a buyer’s negotiating position, particularly where several similar units are available, but it does not erase the premium for scarce attributes such as an excellent floor plan, proximity to an MRT station, a preferred school catchment or an established neighbourhood.
Rents are firmer, but uneven
Private residential rents increased 0.7% in Q2, faster than the 0.3% increase in Q1. The regional picture again differed: CCR non-landed rents rose 1.2%, RCR rents were unchanged, and OCR rents fell 0.3%.
For investors, this is a reminder not to project one rental trend across the island. A purchase should be tested against conservative rent assumptions, vacancy periods, property tax, maintenance, financing costs and the likely tenant pool. Rental growth can support holding income, but it is not a substitute for prudent entry pricing.
The bottom line for Q3 and beyond
Singapore’s Q2 2026 data supports calling the market more measured and selective, not broadly weak. Overall prices are still higher; non-landed prices have softened marginally; resale activity has strengthened; and the supply pipeline is expanding. The strongest implication is that the market is rewarding preparation.
Buyers should secure financing clarity, compare like-for-like homes and negotiate from evidence. Sellers should study current competing listings and recent transactions before setting a price. Investors should underwrite cash flow conservatively and avoid relying on uniform capital appreciation. As URA has noted, the macroeconomic outlook remains uncertain, so prudence in both property selection and mortgage commitments is essential.
Sources
- URA: Release of 2nd Quarter 2026 real estate statistics (24 July 2026)
- 99.co: Private housing Q1 2026—Prices edge up while activity slows (24 April 2026)
Disclaimer
This information is provided solely on a goodwill basis, and does not relieve parties of their responsibility to verify the information from the relevant sources and/or seek appropriate advice from relevant professionals, such as valuers, financial advisors, bankers and lawyers. For avoidance of doubt, PropNex Realty Pte Ltd, and its salesperson, accepts no responsibility for the accuracy, reliability, and/or completeness of the information provided. Copyright in this publication is owned by Sebastian Teo, and this publication may not be reproduce or transmitted in any form, or by any means in whole, or in part, without prior written approval.